GDB
The GNU Project Debugger http://www.gnu.org/software/gdb/
- The debugger on GNU/Linux, available for most embedded architectures.
- Supported languages: C, C++, Pascal, Objective-C, Fortran, Ada...
- Console interface (useful for remote debugging).
- Graphical front-ends available.
- Can be used to control the execution of a program, set breakpoints or change internal variables. You can also use it to see what a program was doing when it crashed (by loading its memory image, dumped into a core file). See also http://en.wikipedia.org/wiki/Gdb
GDB crash course
- A few useful GDB commands
- break foobar puts a breakpoint at the entry of function foobar()
- break foobar.c:42 puts a breakpoint in foobar.c, line 42
- print var or print task->files[0].fd prints the variable var, or a more complicated reference. GDB can also nicely display structures with all their members
- continue continue the execution
- next continue to the next line, stepping over function calls
- step continue to the next line, entering into subfunctions
- backtrace display the program stack
GDB graphical front-ends
- DDD - Data Display Debugger http://www.gnu.org/software/ddd/ A popular graphical front-end, with advanced data plotting capabilities.
- GDB/Insight http://sourceware.org/insight/ From the GDB maintainers.
- KDbg http://www.kdbg.org/ Another front-end, for the K Display Environment.
- Integration with other IDEs: Eclipse, Emacs, KDevelop, etc.
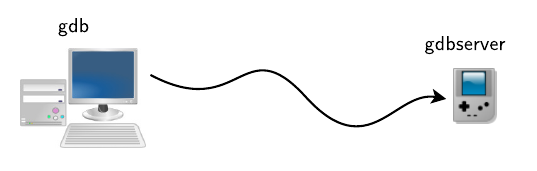
Remote debugging
- In a non-embedded environment, debugging takes place using gdb or one of its front-ends.
- gdb has direct access to the binary and libraries compiled with debugging symbols.
- However, in an embedded context, the target platform environment is often too limited to allow direct debugging with gdb (2.4 MB on x86).
- Remote debugging is preferred
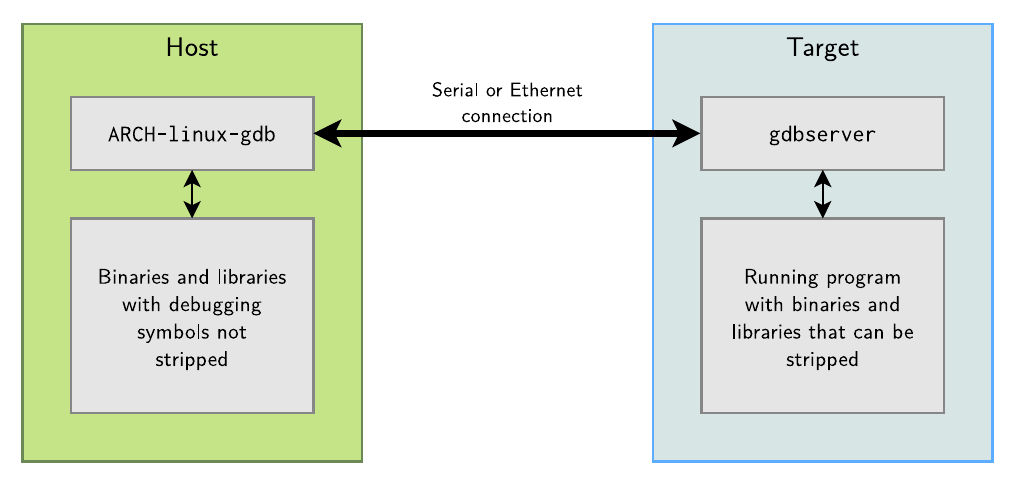
- gdb is used on the development workstation, offering all its features.
- gdbserver is used on the target system (only 100 KB on arm).
usage
- On the target, run a program through gdbserver. Program execution will not start immediately.
gdbserver localhost:
gdbserver /dev/ttyS0 - Otherwise, attach gdbserver to an already running program:
gdbserver --attach localhost:
- Then, on the host, run the ARCH-linux-gdb program, and use the following gdb commands:
- To connect to the target:
gdb> target remote
: (networking) gdb> target remote /dev/ttyS0 (serial link) - To tell gdb where shared libraries are:
gdb> set sysroot
(without lib/)
Post mortem analysis
- When an application crashes due to a segmentation fault and the application was not under control of a debugger, we get no information about the crash
- Fortunately, Linux can generate a core file that contains the image of the application memory at the moment of the crash, and gdb can use this core file to let us analyze the state of the crashed application
- On the target
- Use ulimit -c unlimited to enable the generation of a core file when a crash occurs
- On the host
- After the crash, transfer the core file from the target to the host, and run ARCH-linux-gdb -c core-file application-binary